Oura Ring Insights
Background
I’ve had the 1st generation Oura ring now for nearly a year and have been wearing it almost every night to record my sleep pattern and physiological parameters. Initially, I’ve been wearing it the whole day, until I realized that the ring is not using the heart rate sensor during the day (energy conservation and too many motion artifacts I suppose), so it is essentially a glorified step counter.
I’ve never been quite happy with the app, which reduces the large amounts of information gathered by the ring to a simple sleep- or activity score. At least the cloud site allows visualization of the parameters over time, but doesn’t perform any statistics.
Fortunately, they provide the option to download your data (or even access via their API). With almost 300 data points, I finally decided to dig a bit into my sleep data.
What does the data look like?
Kudos to oura for not using any fancy/proprietary format, but instead just a simple .csv file.
import pandas as pd
raw_data = pd.read_csv('ouradata.csv')
print(raw_data.isnull().any())
raw_data.fillna(method='backfill', inplace=True)
I had a few missing values, which I replaced with those from the previous day.
The variables I picked are those (i.e. only related so sleep):
raw_data.columns
['date', 'Total Sleep Time', 'Respiratory Rate',
       'Average Resting Heart Rate', 'Bedtime Start', 'Bedtime End',
       'Deep Sleep Time', 'Light Sleep Time', 'REM Sleep Time', 'Awake Time',
       'Sleep Latency', 'Lowest Resting Heart Rate', 'Average HRV',
       'Temperature Deviation']
Unlike devices such as fitbit or even smartphone apps, these parameters are determined by measuring the heart rate with very high precision.
The heatmap plot provided by the seaborn library is an easy way to quickly get a very good intuition about the data.
import seaborn as sns
sns.heatmap(raw_data.corr(), annot=True, cmap="YlGnBu")
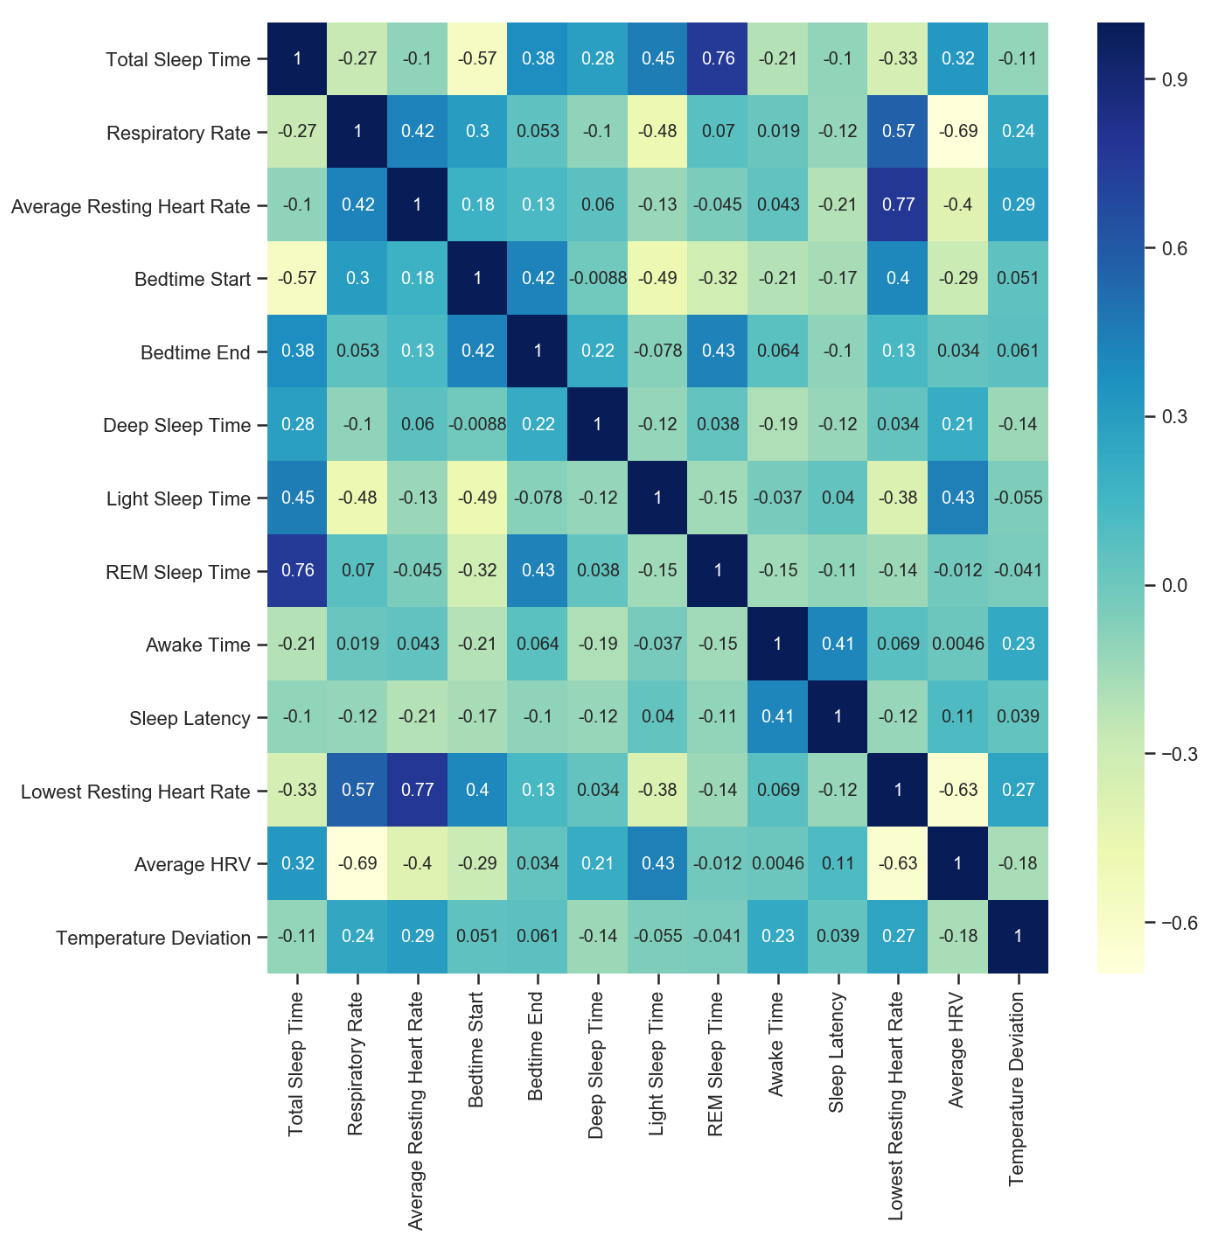
Just a few examples of the wealth of insights we can already get from this simple one-line plot:
-
Total sleep time correlates most strongly with REM sleep, less so with light sleep or deep sleep. The oura app allows displaying the exact timing of the sleep phases during one night. I had noticed that I usually get a certain amount of deep sleep no matter how long I sleep, the rest is just filled up with REM or light sleep.
-
Bedtime Start and Bedtime End give some insights into the sleep phases. REM sleep seems to occur in all phases: It has a negative correlation with Bedtime Start and positive correlation with Bedtime End. Deep sleep seem to occur rather towards the end of the sleep cycle as it is not at all correlated to Bedtime Start, but slightly to Bedtime End. The opposite appears to be the case for light sleep.
-
Heart-rate variability (HRV) is a special measure provided by the oura ring. Because it has a sampling rate of over 200Hz, it can determine the timing between individual heart beats. Apparently (though this may still be subject of research) a low HRV, i.e. very regular timing between beats, is a sign of stress. I think there are several signs in my data that confirm this:
- HRV has a strong negative correlation with respiratory rate.
- With increasing sleep time HRV increases.
- Lower resting heart rate correlates with higher HRV.
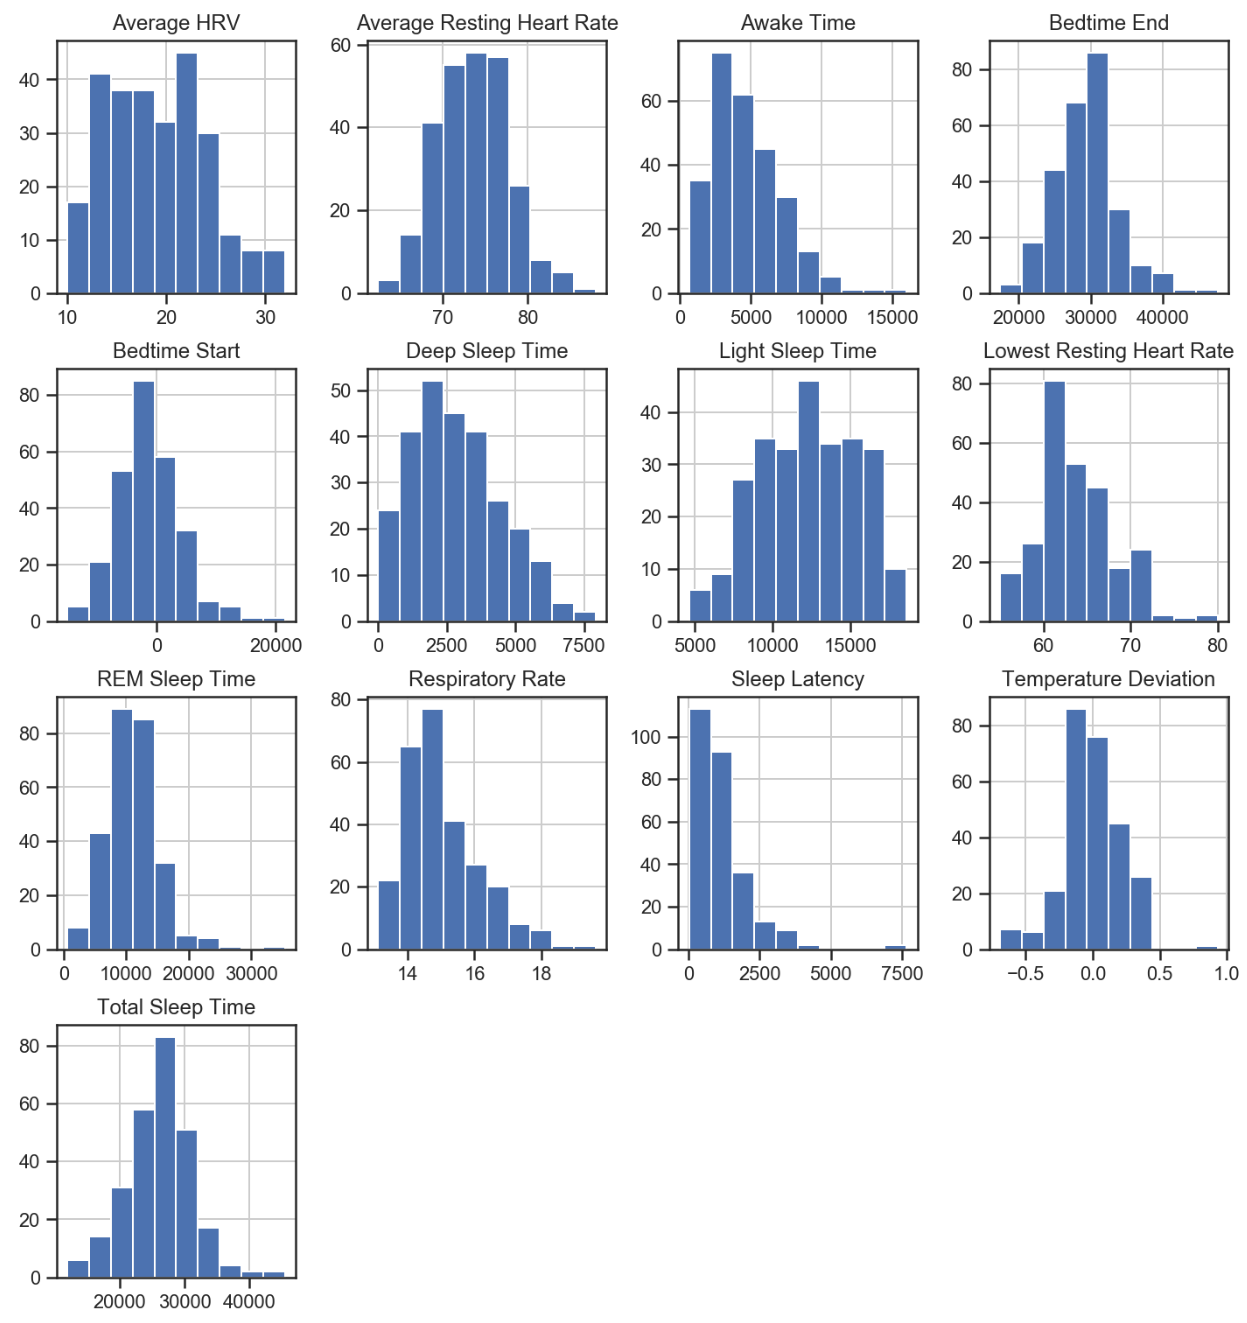
Another useful built-in feature of pandas is to simply display every column as a histogram. This allows us to get a quick overview how the data is distributed.
raw_data.hist()
What’s next?
I’m thinking about how to apply some supervised learning models to this dataset. Obviously I would be interested in dependent variables that I can control, such as optimal sleep timing to improve certain sleep phases.
With the 2nd generation ring that will arrive soon, I should have much more daytime data, as it has more battery power to use the heart-rate monitor during the day and the smaller size, making it less cumbersome to wear during daytime activities. Then I could finally find empirical answers to questions such as: Does doing sports really improve sleep? What kind of daytime activity affects what sleep phases? E.g. high intensity workout vs. just lots of walking throughout the day?
Also the new app will allow inserting custom notes and tags, e.g. to enter drugs, supplements, and food consumed. Having everything in one data set will allow drawing easier conclusions about the effects on physiology and sleep.